Optimizing React for Production

Over the past few days I have been trying to improve the performance of the React web app I manage. While there have been no performance complaints about the web app in question I did notice it takes a while to initially load the web page. But I wanted to quantify the performance before starting so I can measure the performance difference.
Quantifying Performance
First thing I did was to analyse the performance of the website. I used Lighthouse for this purpose. I was only looking at the performance score for now. Before starting the Lighthouse audit, it's better to disable the React Dev tools extension as this affects the score. You can see the devtools bundle being downloaded when loading the app if you don't disable it.
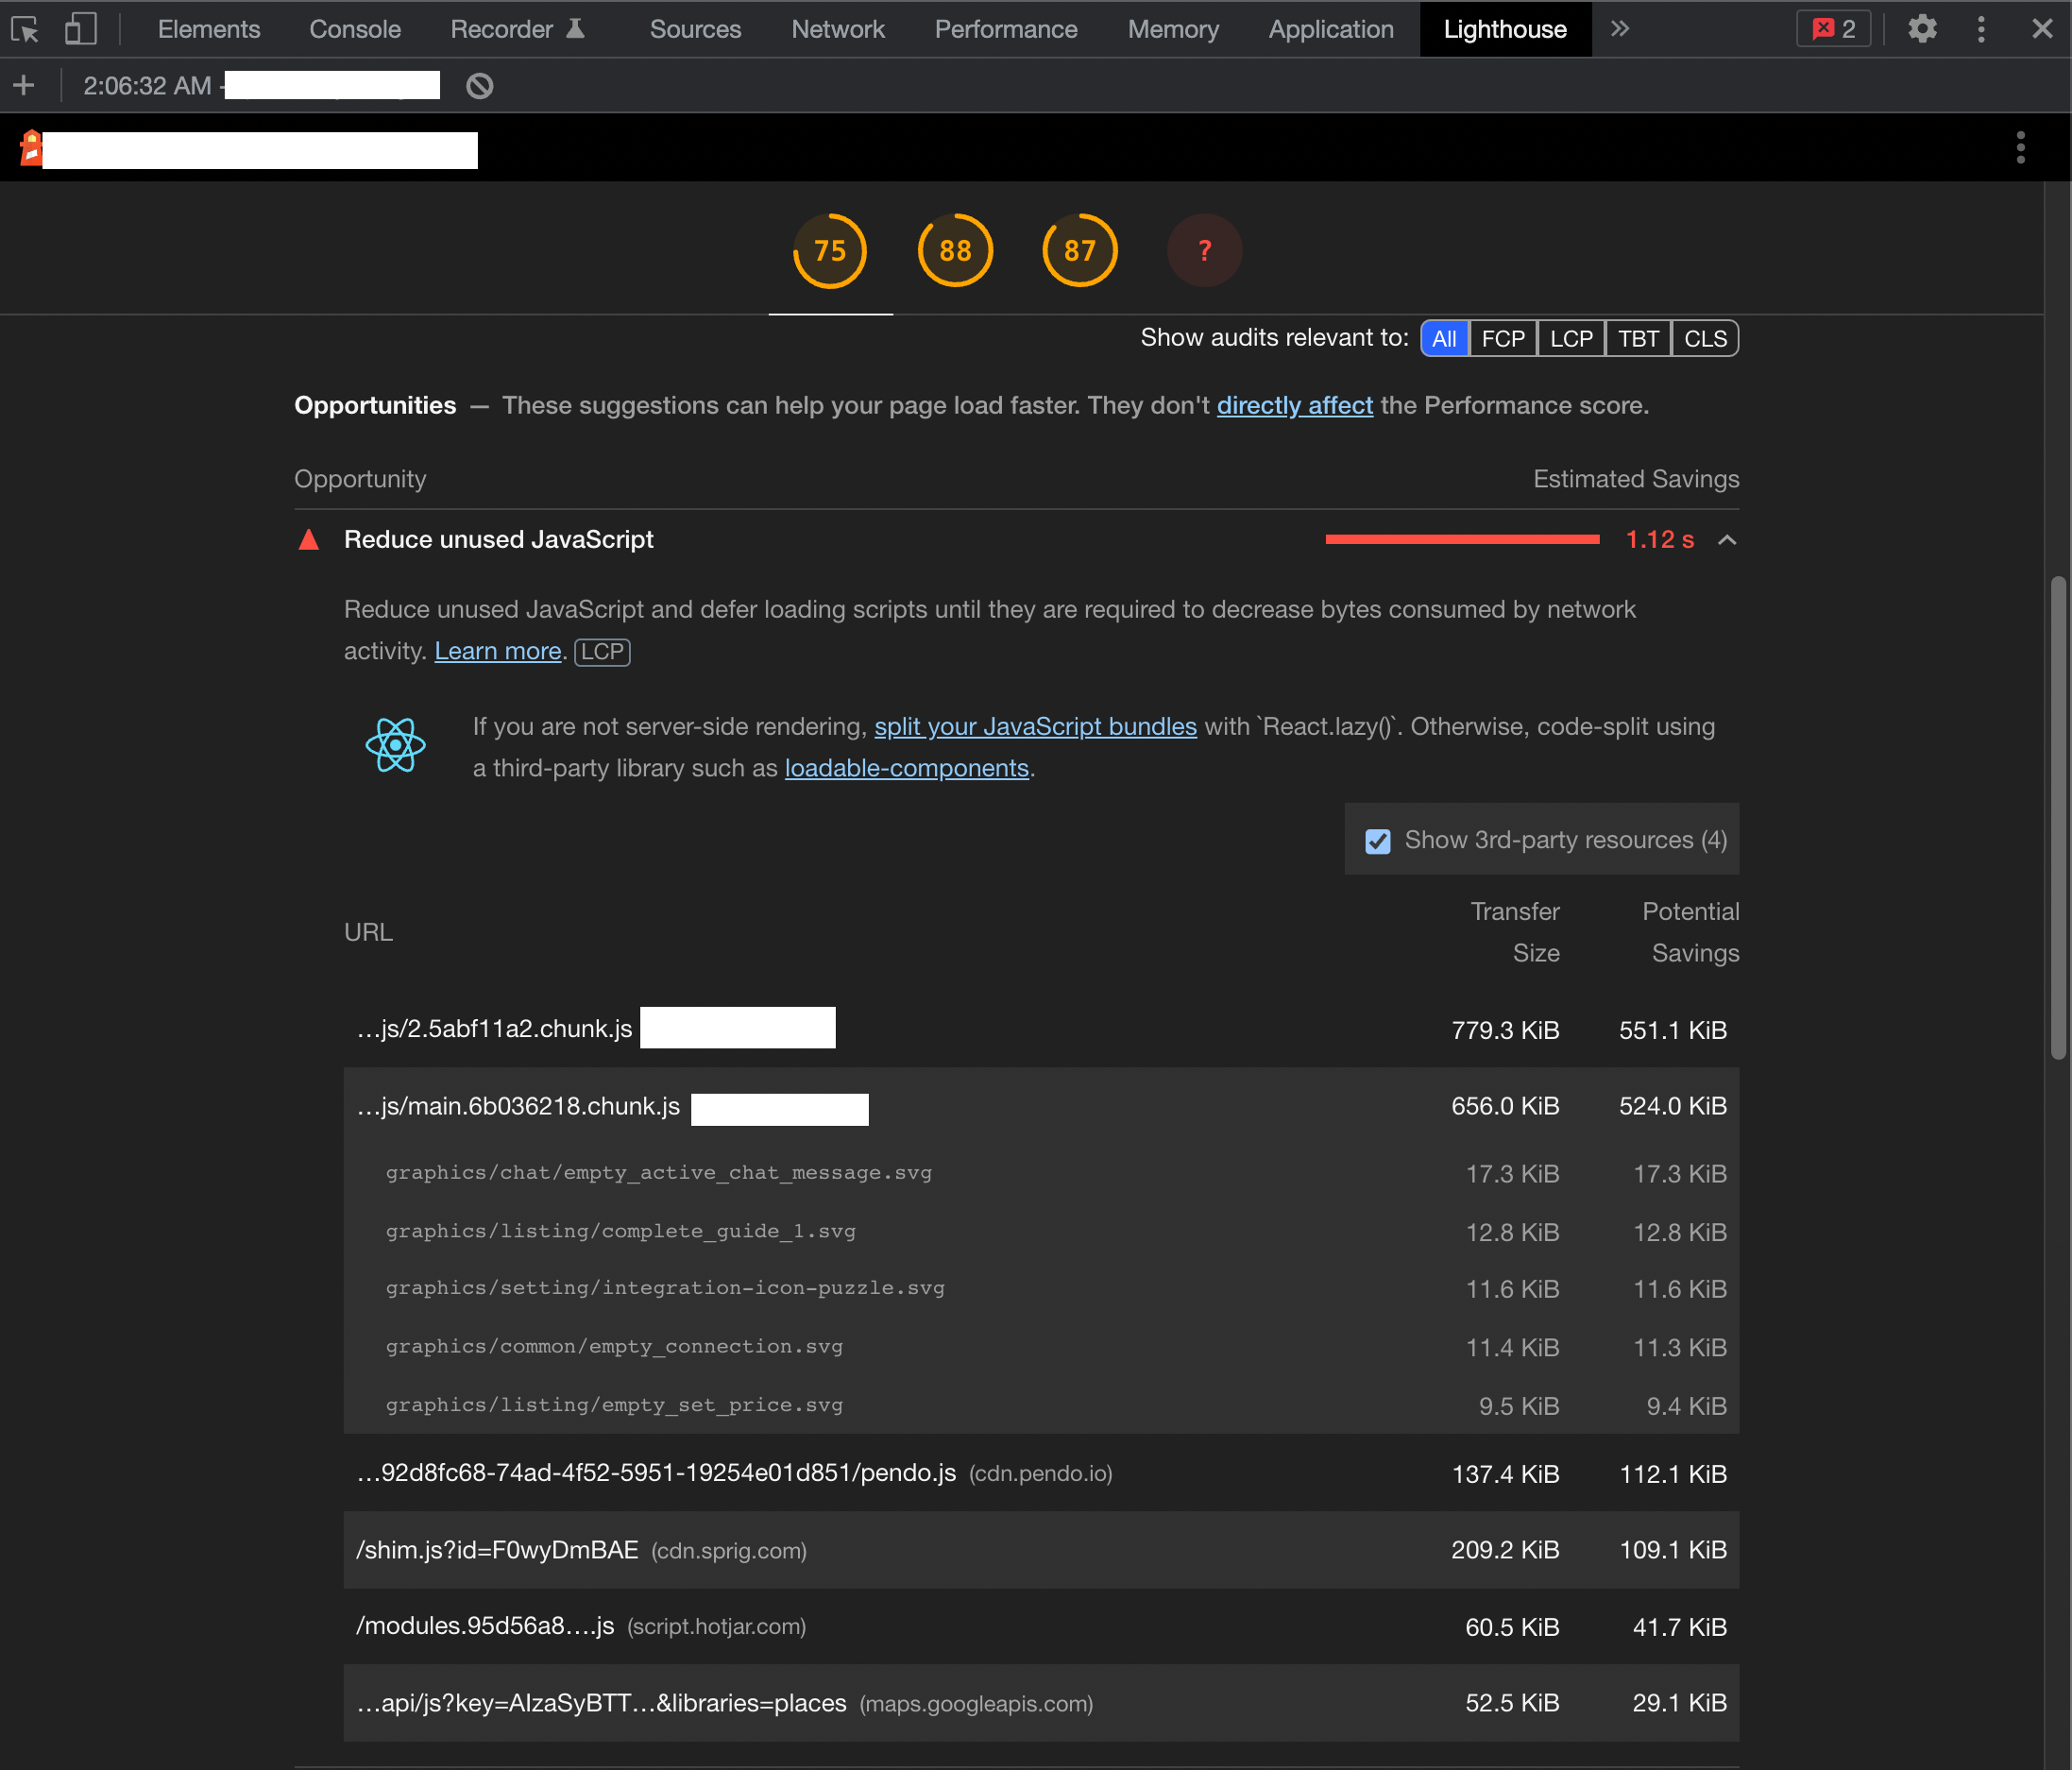
After the analysis you can see your performance score, which we want to be as high as possible. Now my app has a performance score of 75, which is not terrible but not great either.
So we can see in the report what is causing this drop in performance. The first meaningful paint as the name suggests is the time after which a user would see something of your app after entering the URL. It is almost 2 seconds for my app. The Time to be interactive is 2.7. sec.
Identifying the issue
Now you can see there are a list of opportunities listed where performance can be improved. Of these, the major reason seems to be "Reduce unused JavaScript"., which has the list of js files being downloaded from the server with their corresponding file sizes. How Lighthouse says they are unwanted is beyond me! But they are right!
If you can click on the "View Treemap" button you can see a page like this.
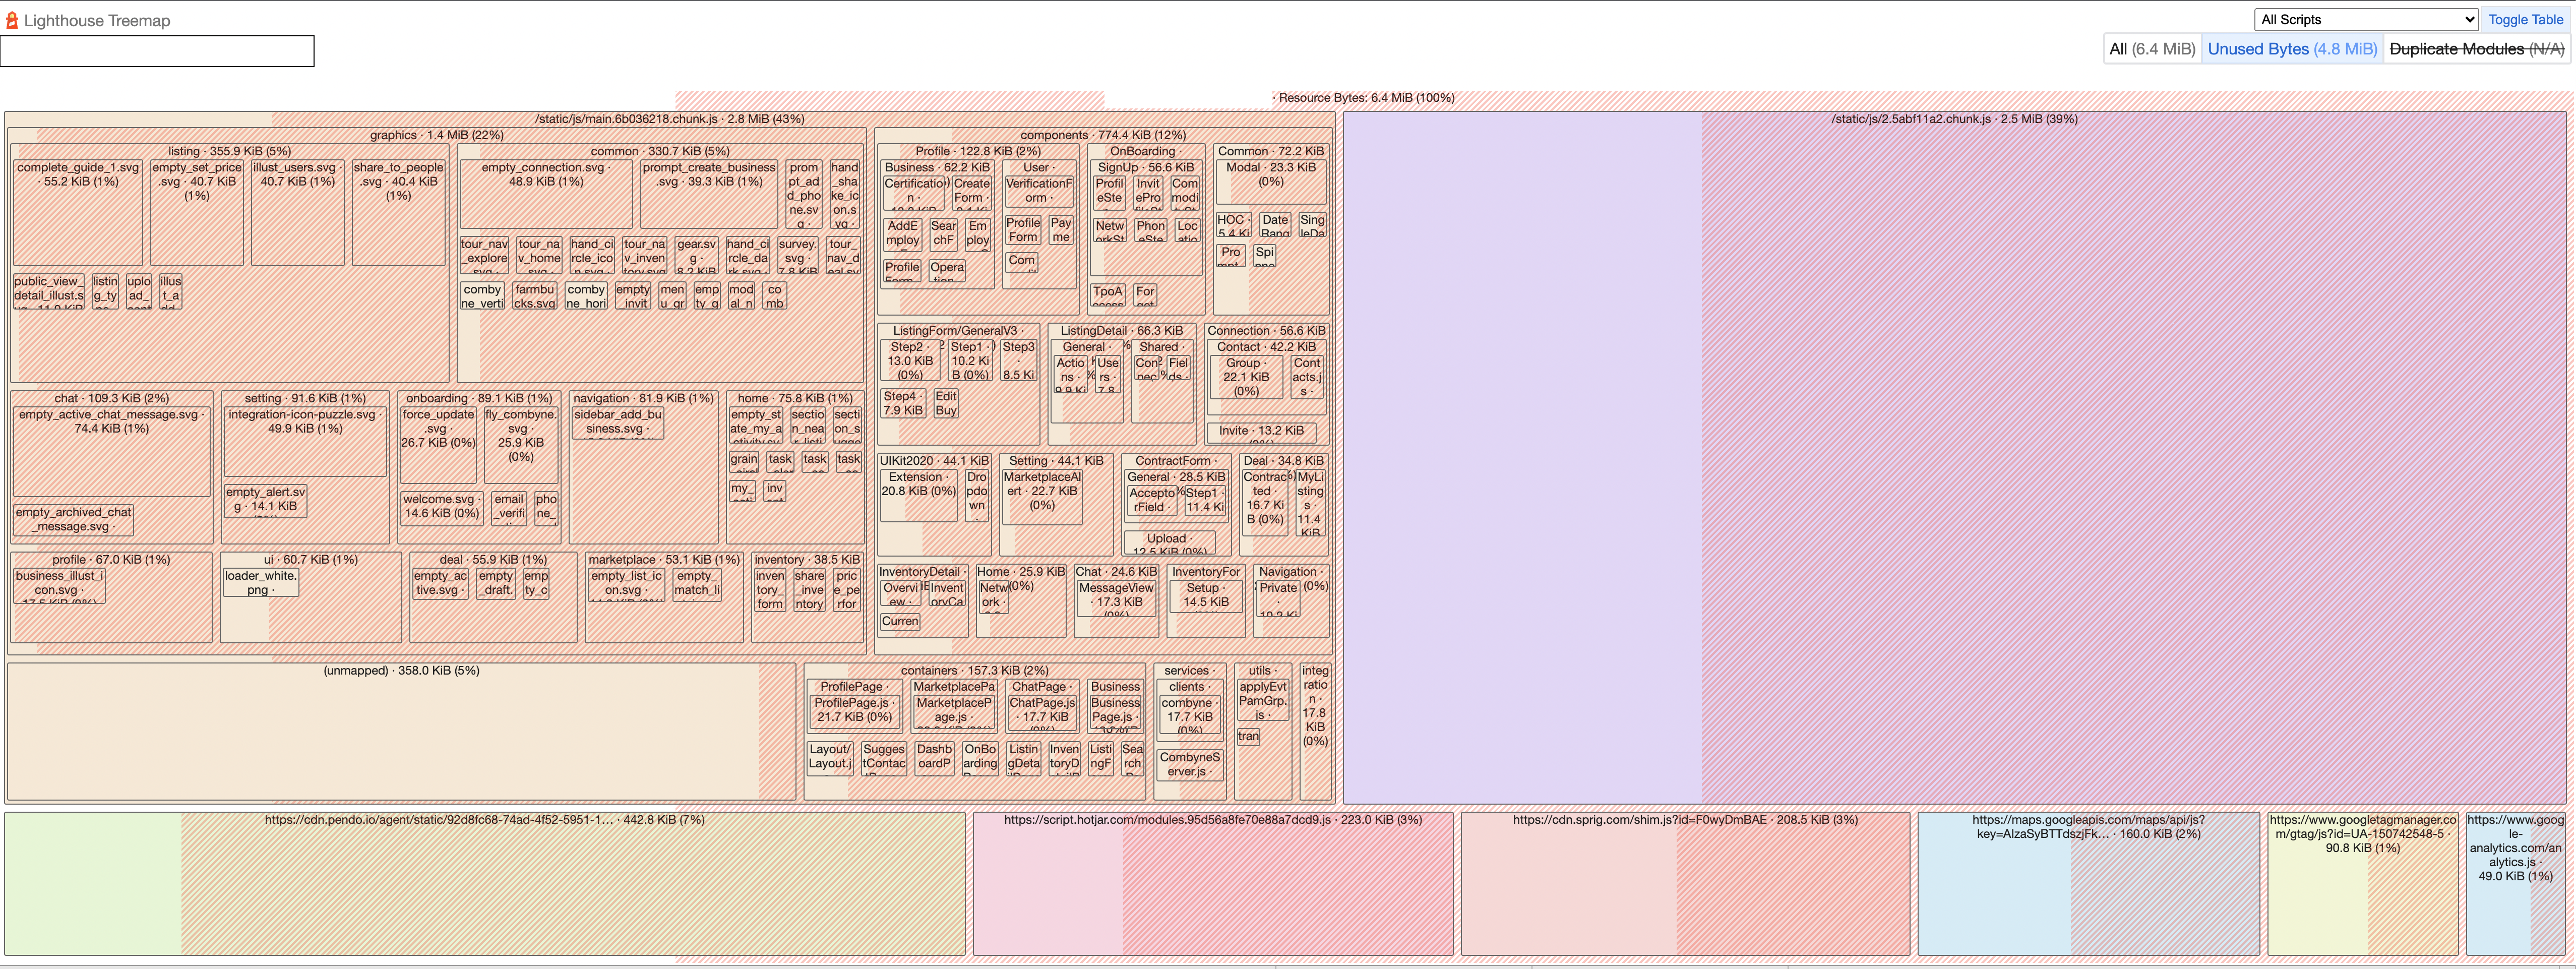
Now this shows all the files that are being loaded when we open the app. If you click on unused bytes you can see most of these are unused. One of the biggest file is main.*.chunk.js which has most of the app code. But why is this whole app being downloaded when I am just viewing the login page ? This is where we can improve our performance. React provides an easy way to do this through Code-Splitting .
The Solution
I was able to lazy load every single component in my app except the Higher Order Components. Not sure why but I'll figure that out later. However the primary target for lazy loading should be the file where you are doing your routing.

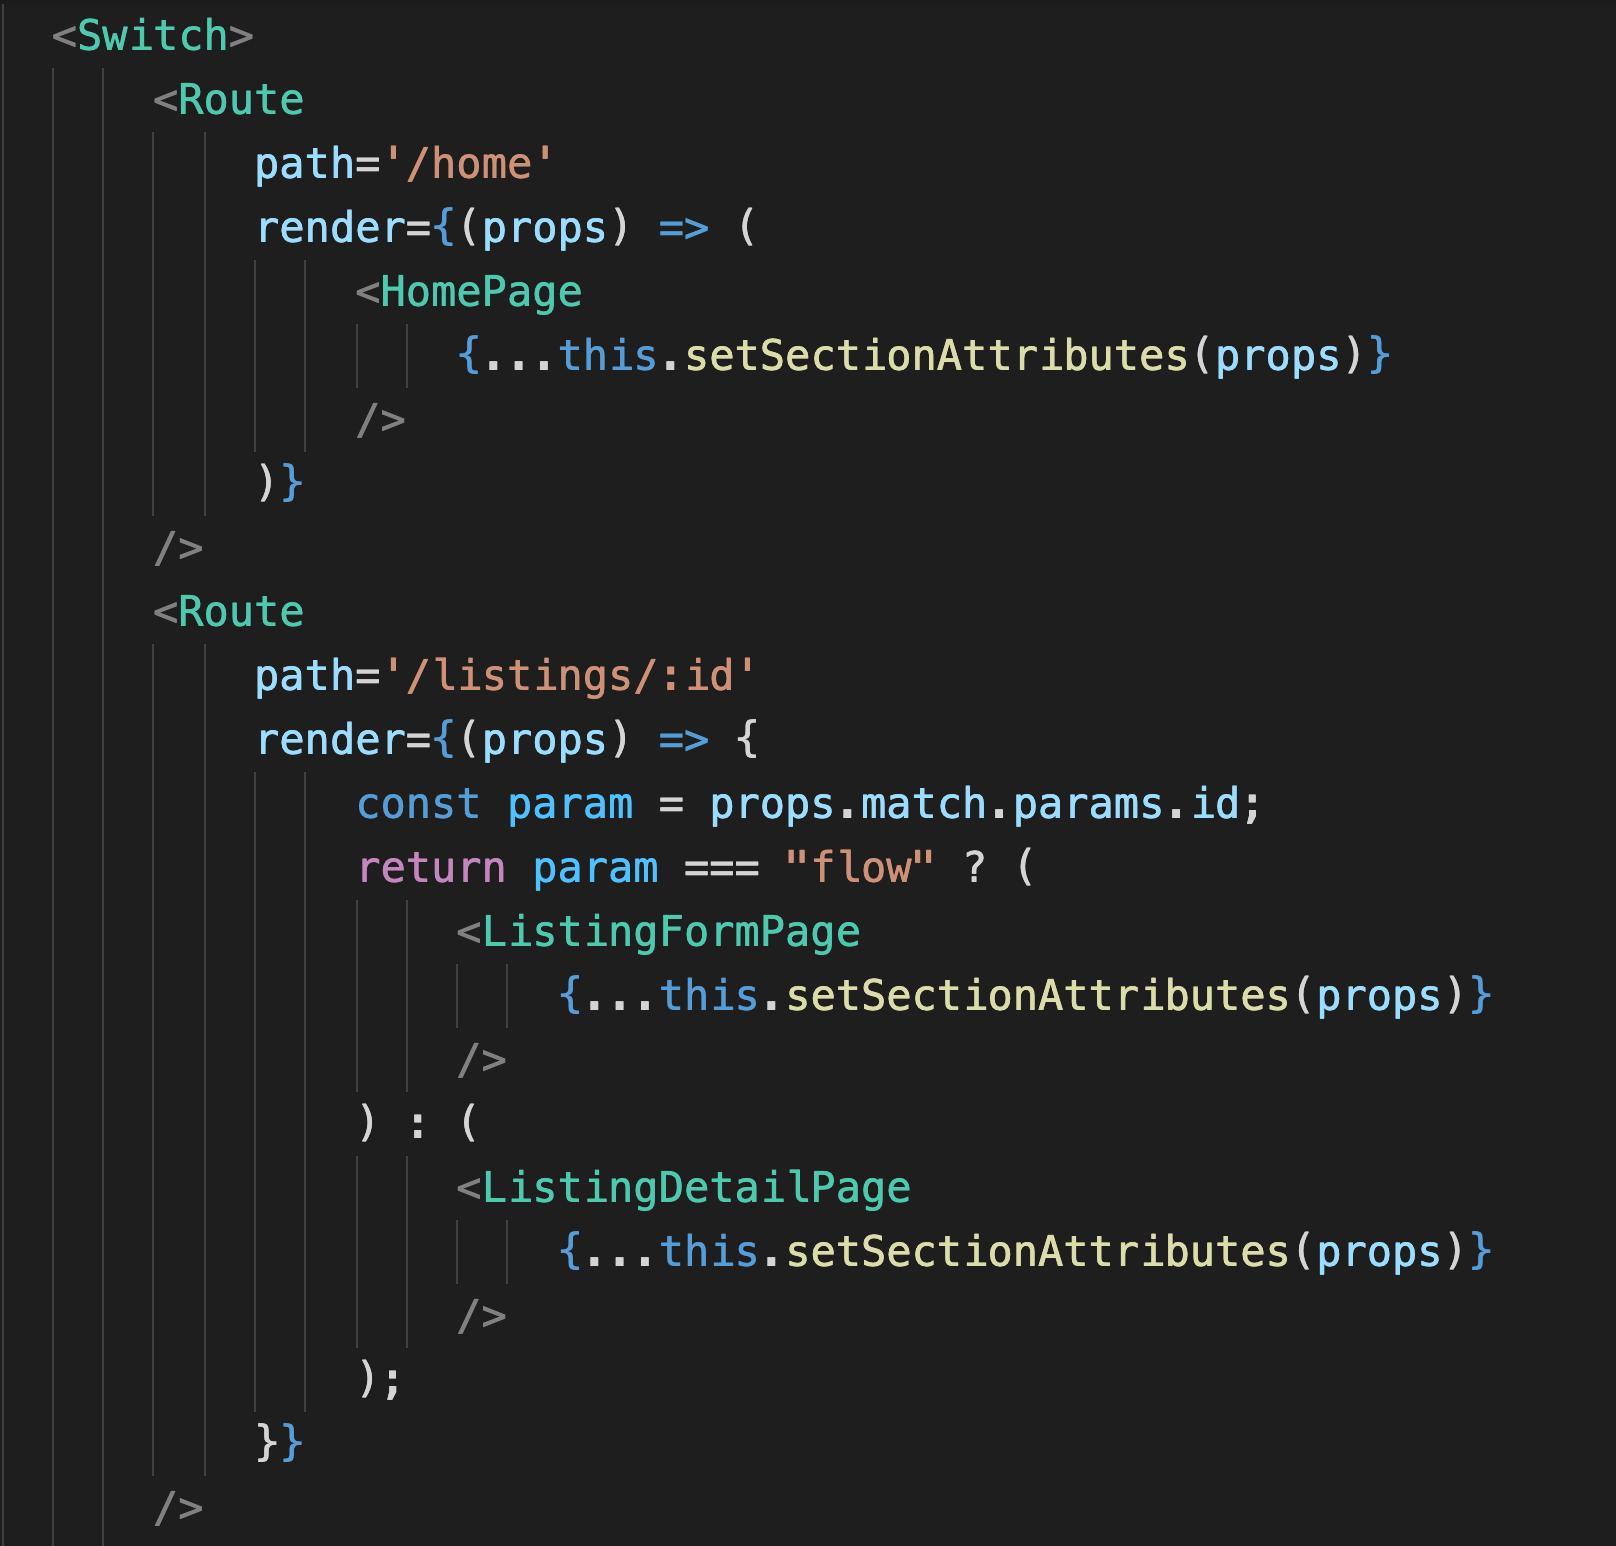
In this file change your imports to look like below.

By lazy loading your imports you are telling React not to include Components that aren't part of the initial bundle.
Checking build file composition
Now we used Lighthouse's View Treemap option to view the composition of our build files previously. However we can also use source map explorer to do the same locally. Create a build and then use the following command to view the source map for your build files.
source-map-explorer build/static/*.js
Note: You must generate builds with Source maps for this to work. If you have disabled source maps generation with GENERATE_SOURCEMAP=false during build this won't work.
First thing I noticed was that there are a lot more bundles now but with a smaller footprint.
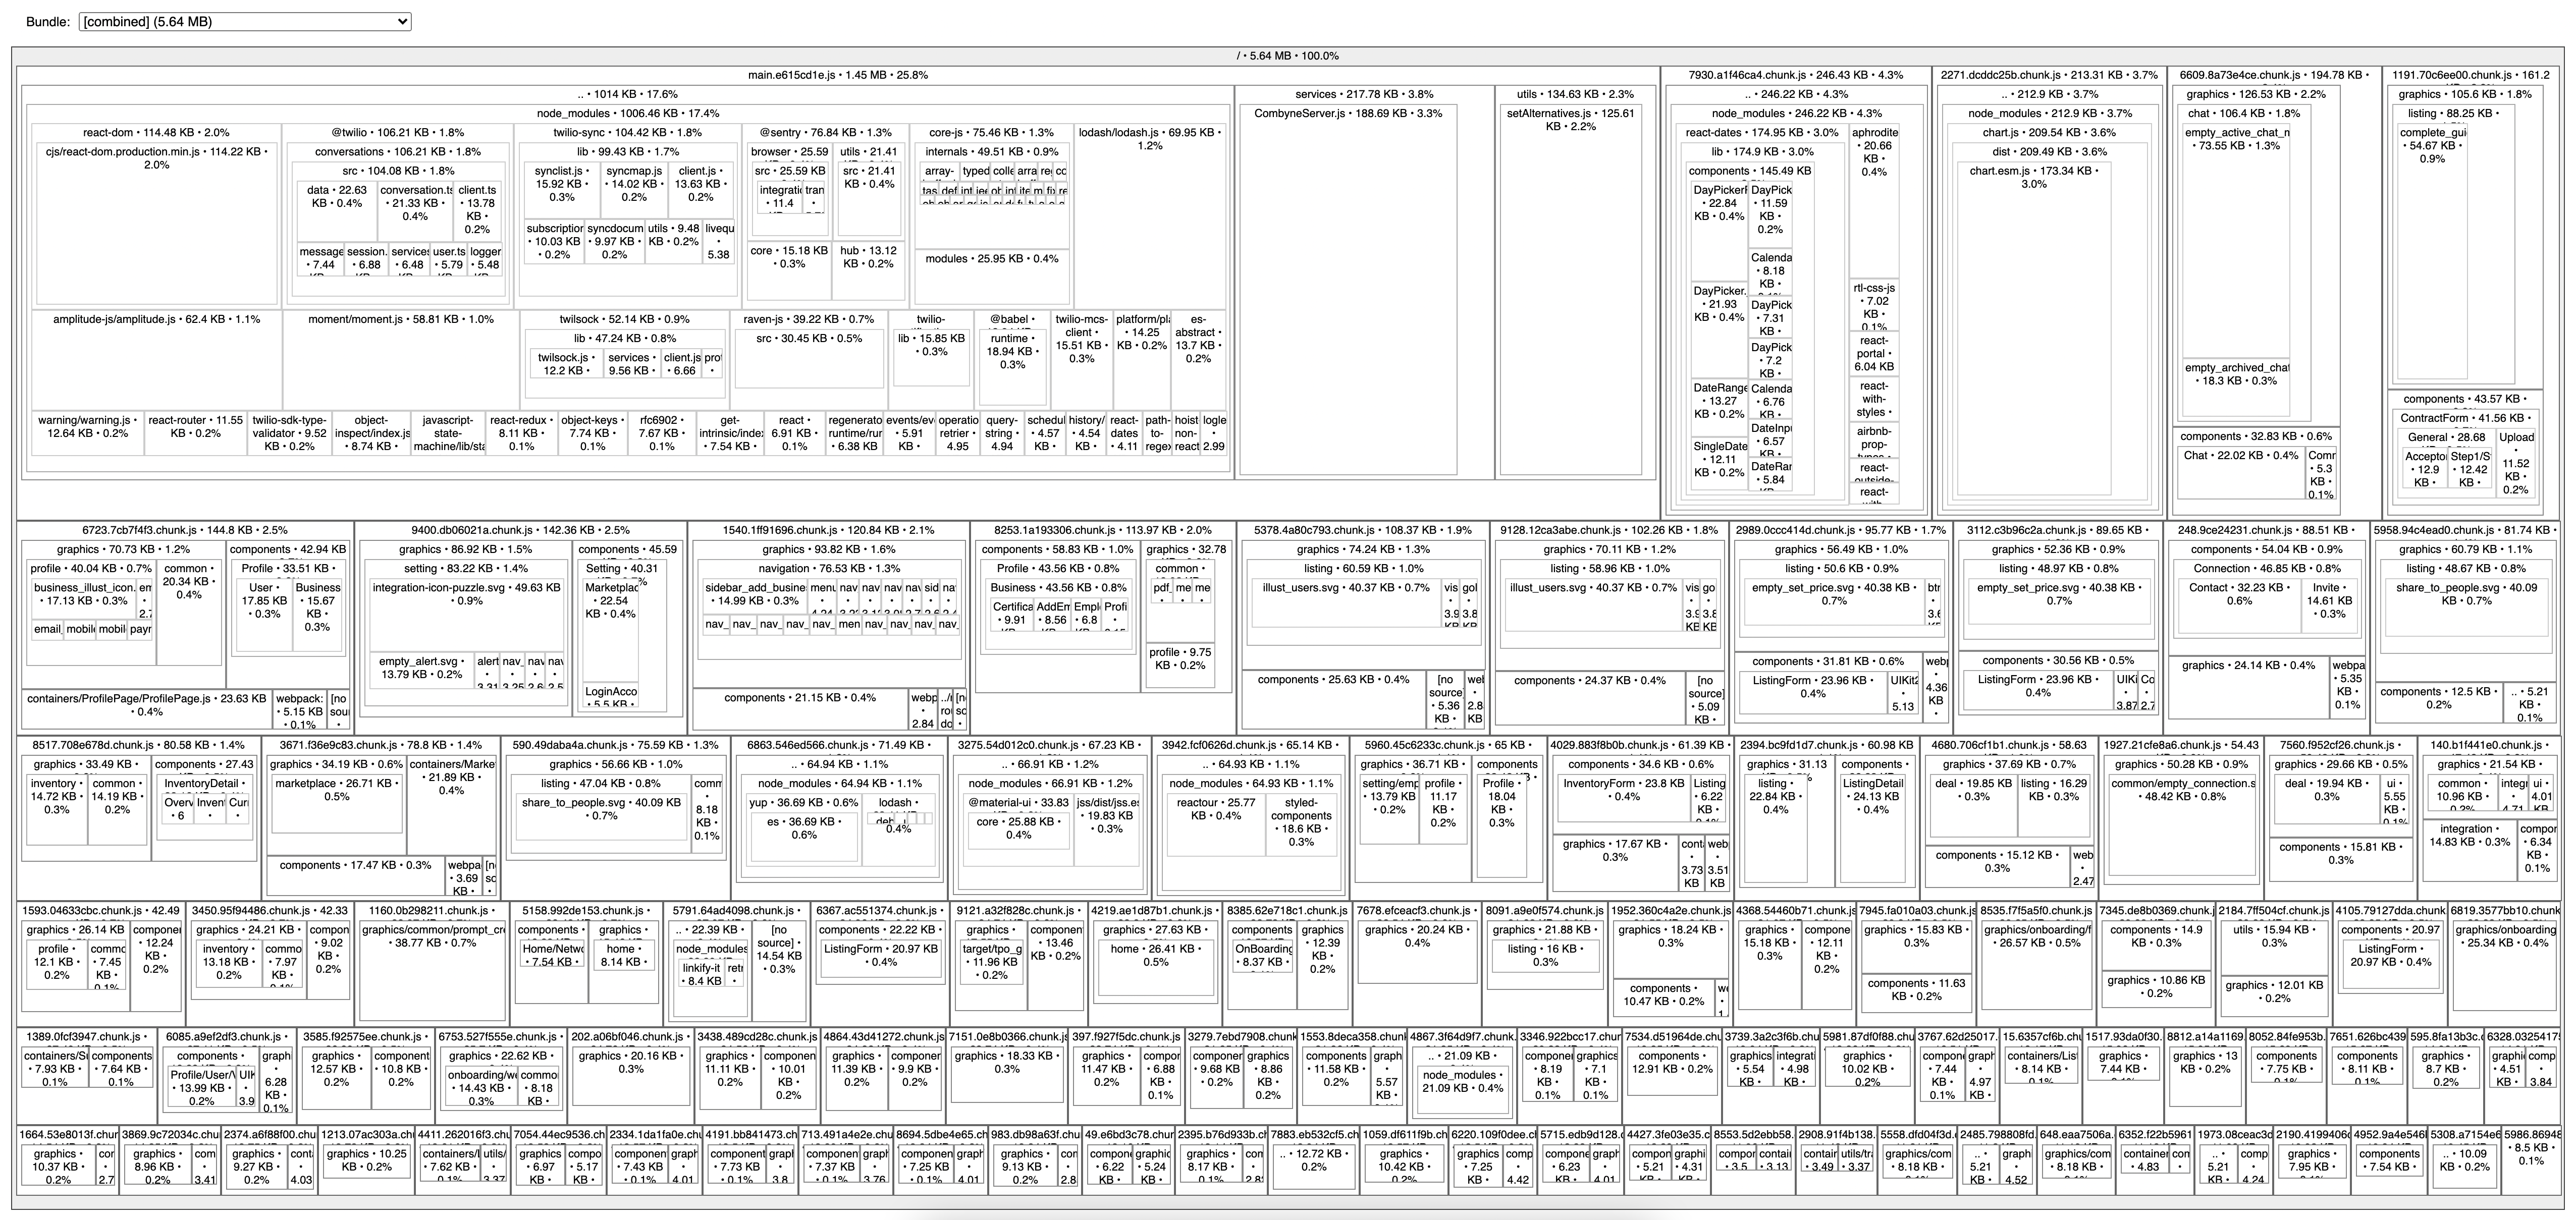
Now we want to look primarily at the main.*.js file which is usually the biggest bundle that loads when the web app is first opened. So select the main file from the drop down at top of the source map explorer page.
In this main bundle the components/containers included are just a few compared to almost everything before we implemented lazy loading.

I deployed my build and now these are the Lighthouse scores now
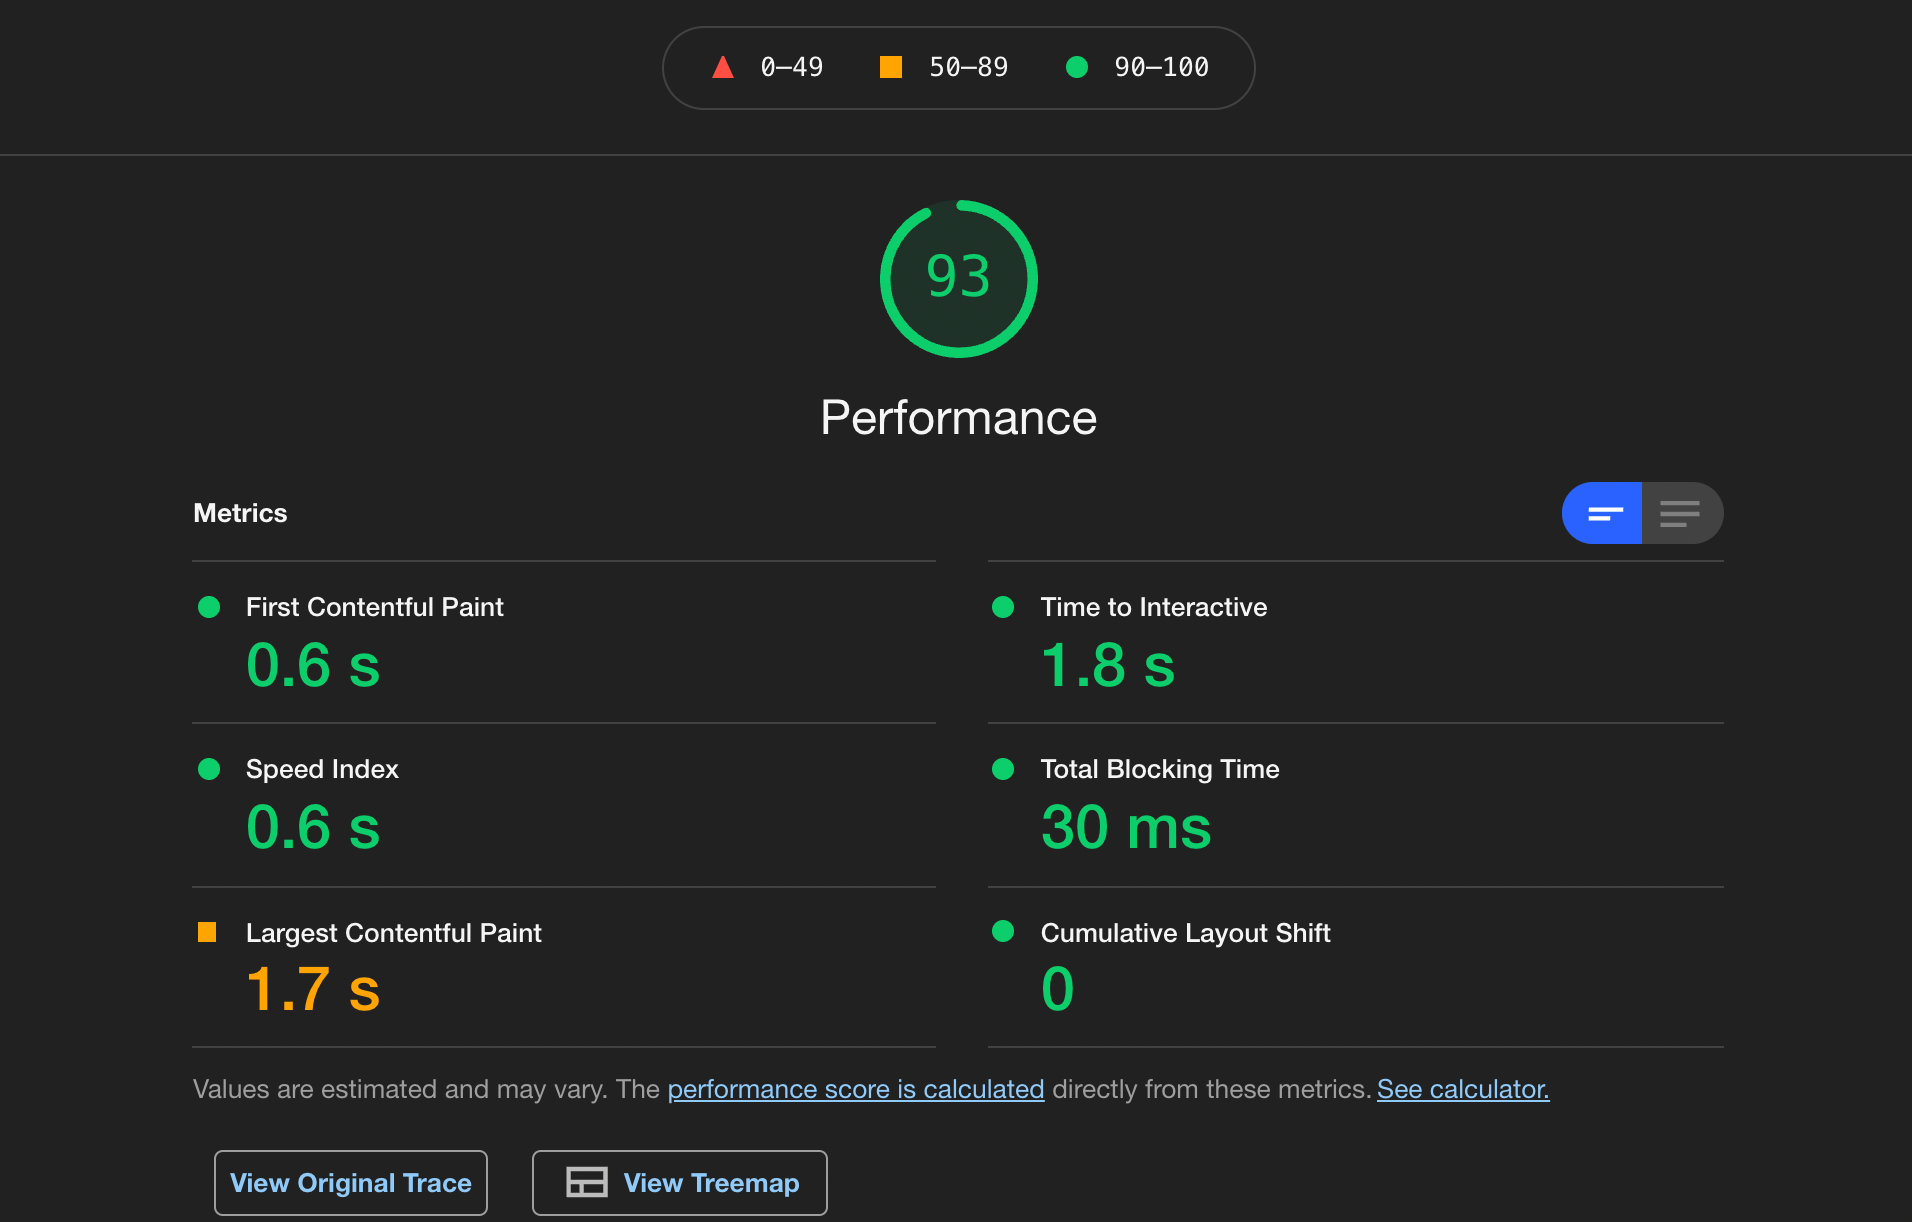
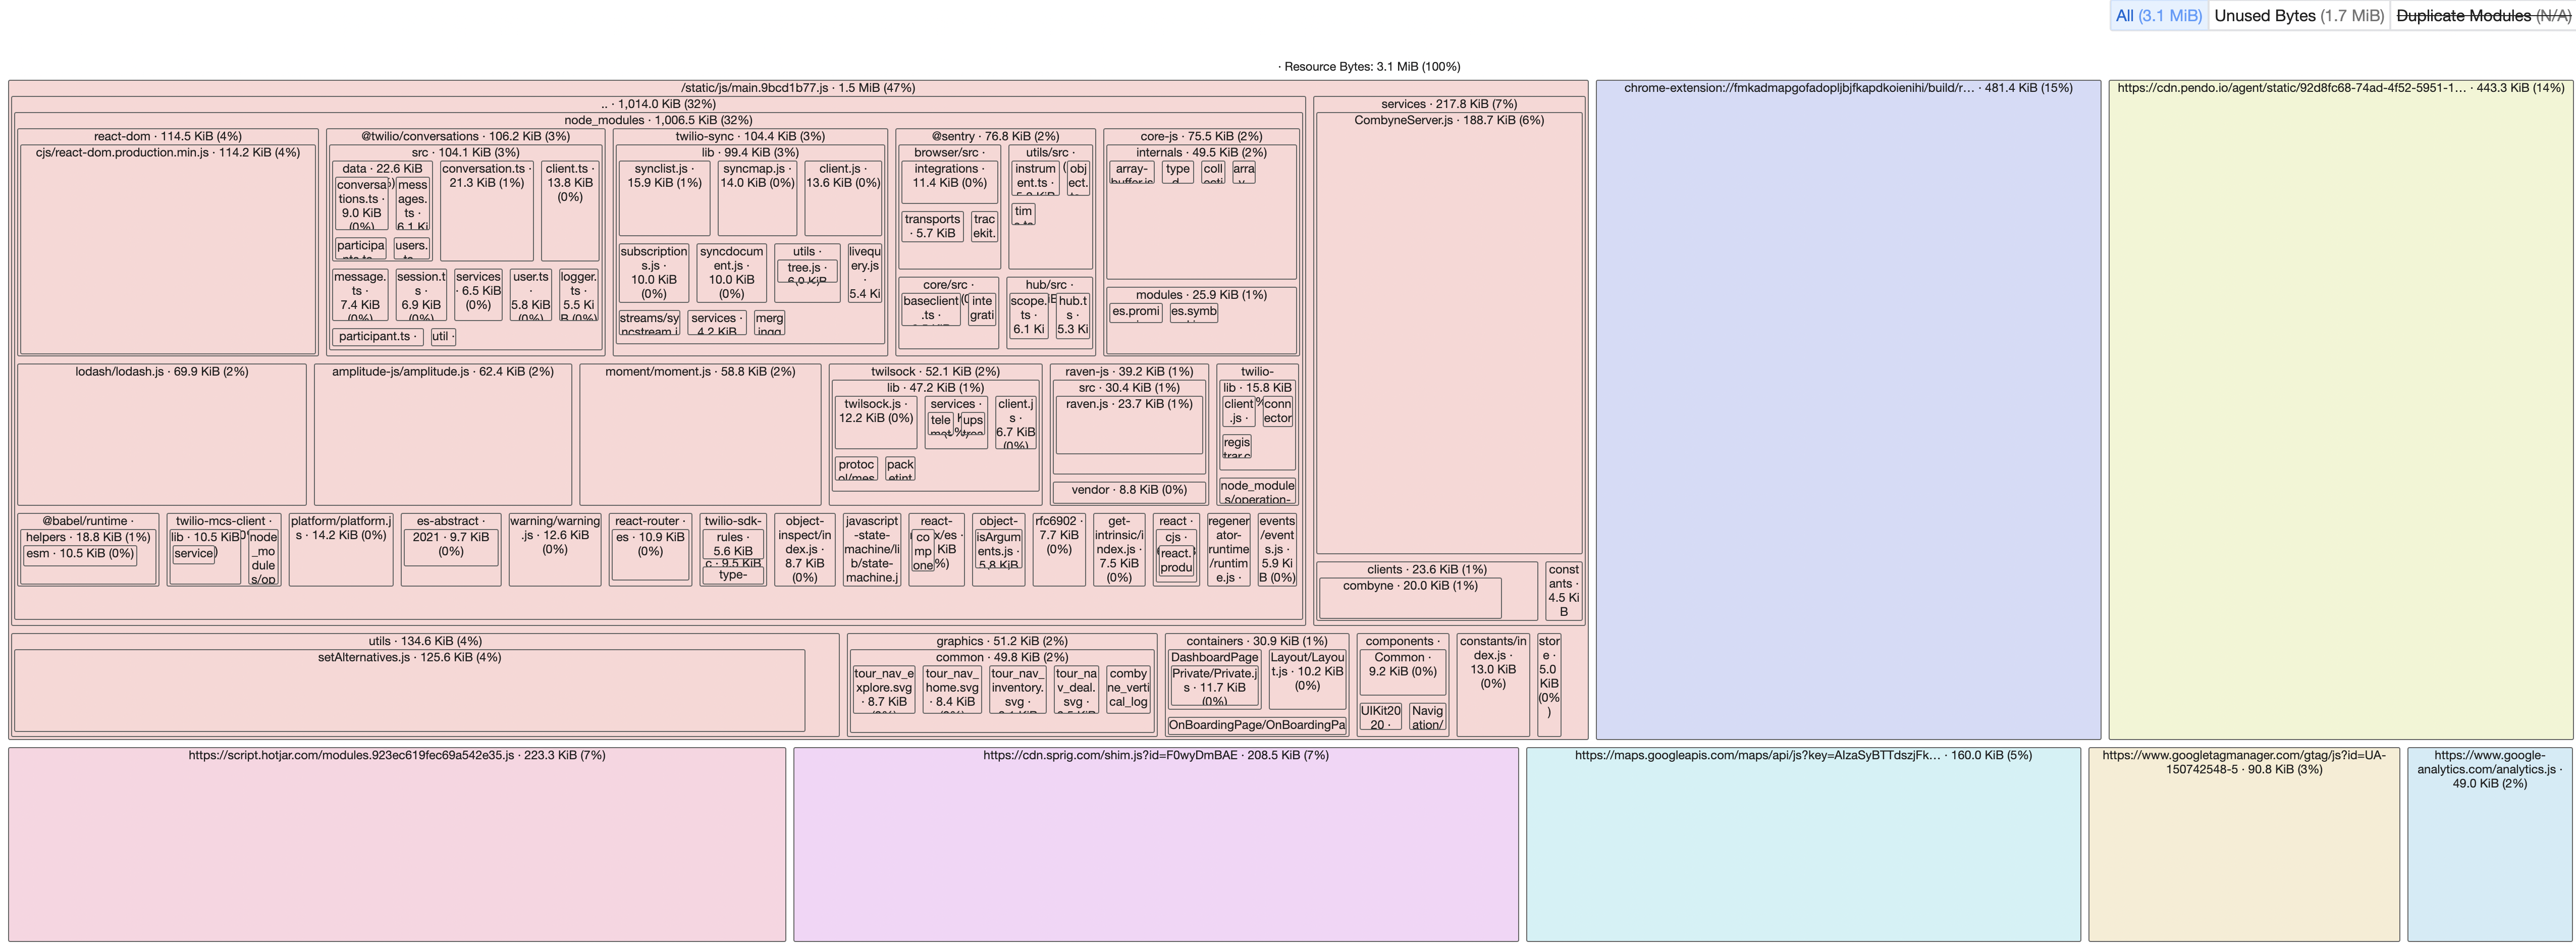
The Performance is now 93. Just by making a small change to the way components are imported we are able to bring about a huge performance boost. Checking on the Treemap now we can see even the bundle size has reduced by half and only the essential components needed to render the app's initial page are in the treemap.
Next Step
There is still scope of improvement but for that we need to optimise the network request as there is a pretty big network request being done when the app is loaded that takes almost 0.5 seconds. I'll explore caching strategies to minimise the impact of the request next.
