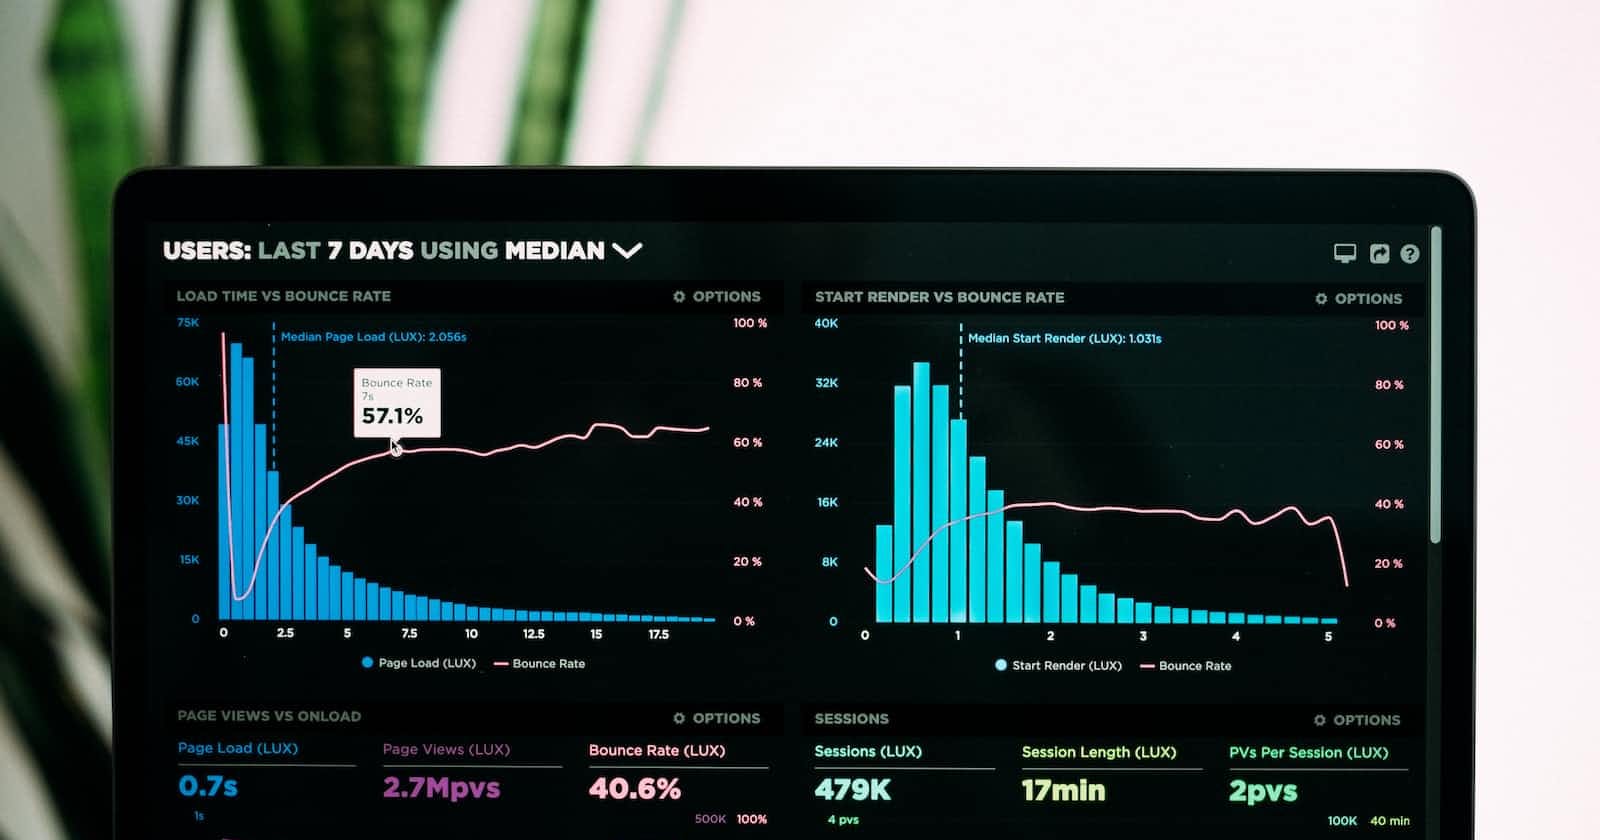
D3.js is my go to library for creating charts simply because of the range of charts and the ease with which you can create them. Also the charts you create with D3.js are svg charts which are the best type of charts to have on a webpage compared to alteratives such as canvas based charts for most use cases.
Bar Progress Chart
Let's create the following progress bar chart in D3.js

import * as d3 from 'd3';

interface ProgressBarChartProps {
  fillPercentage: number;
  fillColor: string;
}

const ProgressBarChart: FC<ProgressBarChartProps> = ({
  fillPercentage, fillColor
}: ProgressBarChartProps) => {
  const ref = useRef<any>();
  useEffect(() => {
    const svgElement = d3.select(ref.current).append('svg');
    svgElement
      .append('rect')
      .attr('rx', 3)
      .attr('ry', 3)
      .attr('fill', '#E0E0E0')
      .attr('height', 14)
      .attr('width', function () {
        return 100;
      })
      .attr('x', 0);

    svgElement
      .append('rect')
      .attr('rx', 3)
      .attr('ry', 3)
      .attr('fill', fillColor)
      .attr('height', 14)
      .attr('width', function () {
        return fillPercentage;
      })
      .attr('x', 0);
  }, []);
  return <svg ref={ref} width="100px" height="15px" />;
};

export default ProgressBarChart;
The above code will create a Progress bar where the color of the progress section is passed a prop. We can further customize this by passing the the height and width of the bar too.
Here we are first creating a svg element and then using d3.js to append 2 rectangular boxes to it, the first svgElement.append('rect')
creates the background of our progress bar and the 2nd svgElement.append('rect')
creates the actual progress section with our custom fill color for the fill percentage we pass as props.


